60 findings on how leaders and organisations make decisions, each traced to the study that produced it. Where a popular statistic has no source or has failed to replicate, we say so.
How to cite this pageThe most-cited findings first. Each one names its source, year and sample.
of executives say their organisation excels at decision making.
of managers' working time goes on decisions, and 61% say most of that time is used ineffectively.
Decision process mattered six times more than analysis across 1,048 major business decisions.
of 356 organisational decisions failed, judged by whether they were still in use two years later.
of routine operational decisions are expected to be made by AI by 2030, up from 25% today.
of employees say they have made mistakes in their work because of AI.
A loss weighs about twice as much as an equal gain: the mean loss aversion coefficient is 1.955.
of the time, CFOs' 80% confidence ranges contained the actual stock market result.
of 16,000+ projects ran over budget, over schedule or both.
typical difference between two underwriters pricing the same case. Their executives expected 10%.
Groups missing shared information were about eight times less likely to reach the right answer.
People rate the same decision as better when it turns out well, even when they say outcomes should not matter.
average overrun among the 18% of IT projects that went more than 50% over budget.
effect size for ego depletion, the main theory behind decision fatigue, in a 23-lab replication.
Each statistic was traced back to the organisation or researchers who produced it, and checked against the original wording. We recorded the year, the sample size and the method, and noted where the figure is commonly repeated in a form the source does not support.
This page was last checked on 12 October 2026. Spotted an error or a better source? Contact us and we will update it.
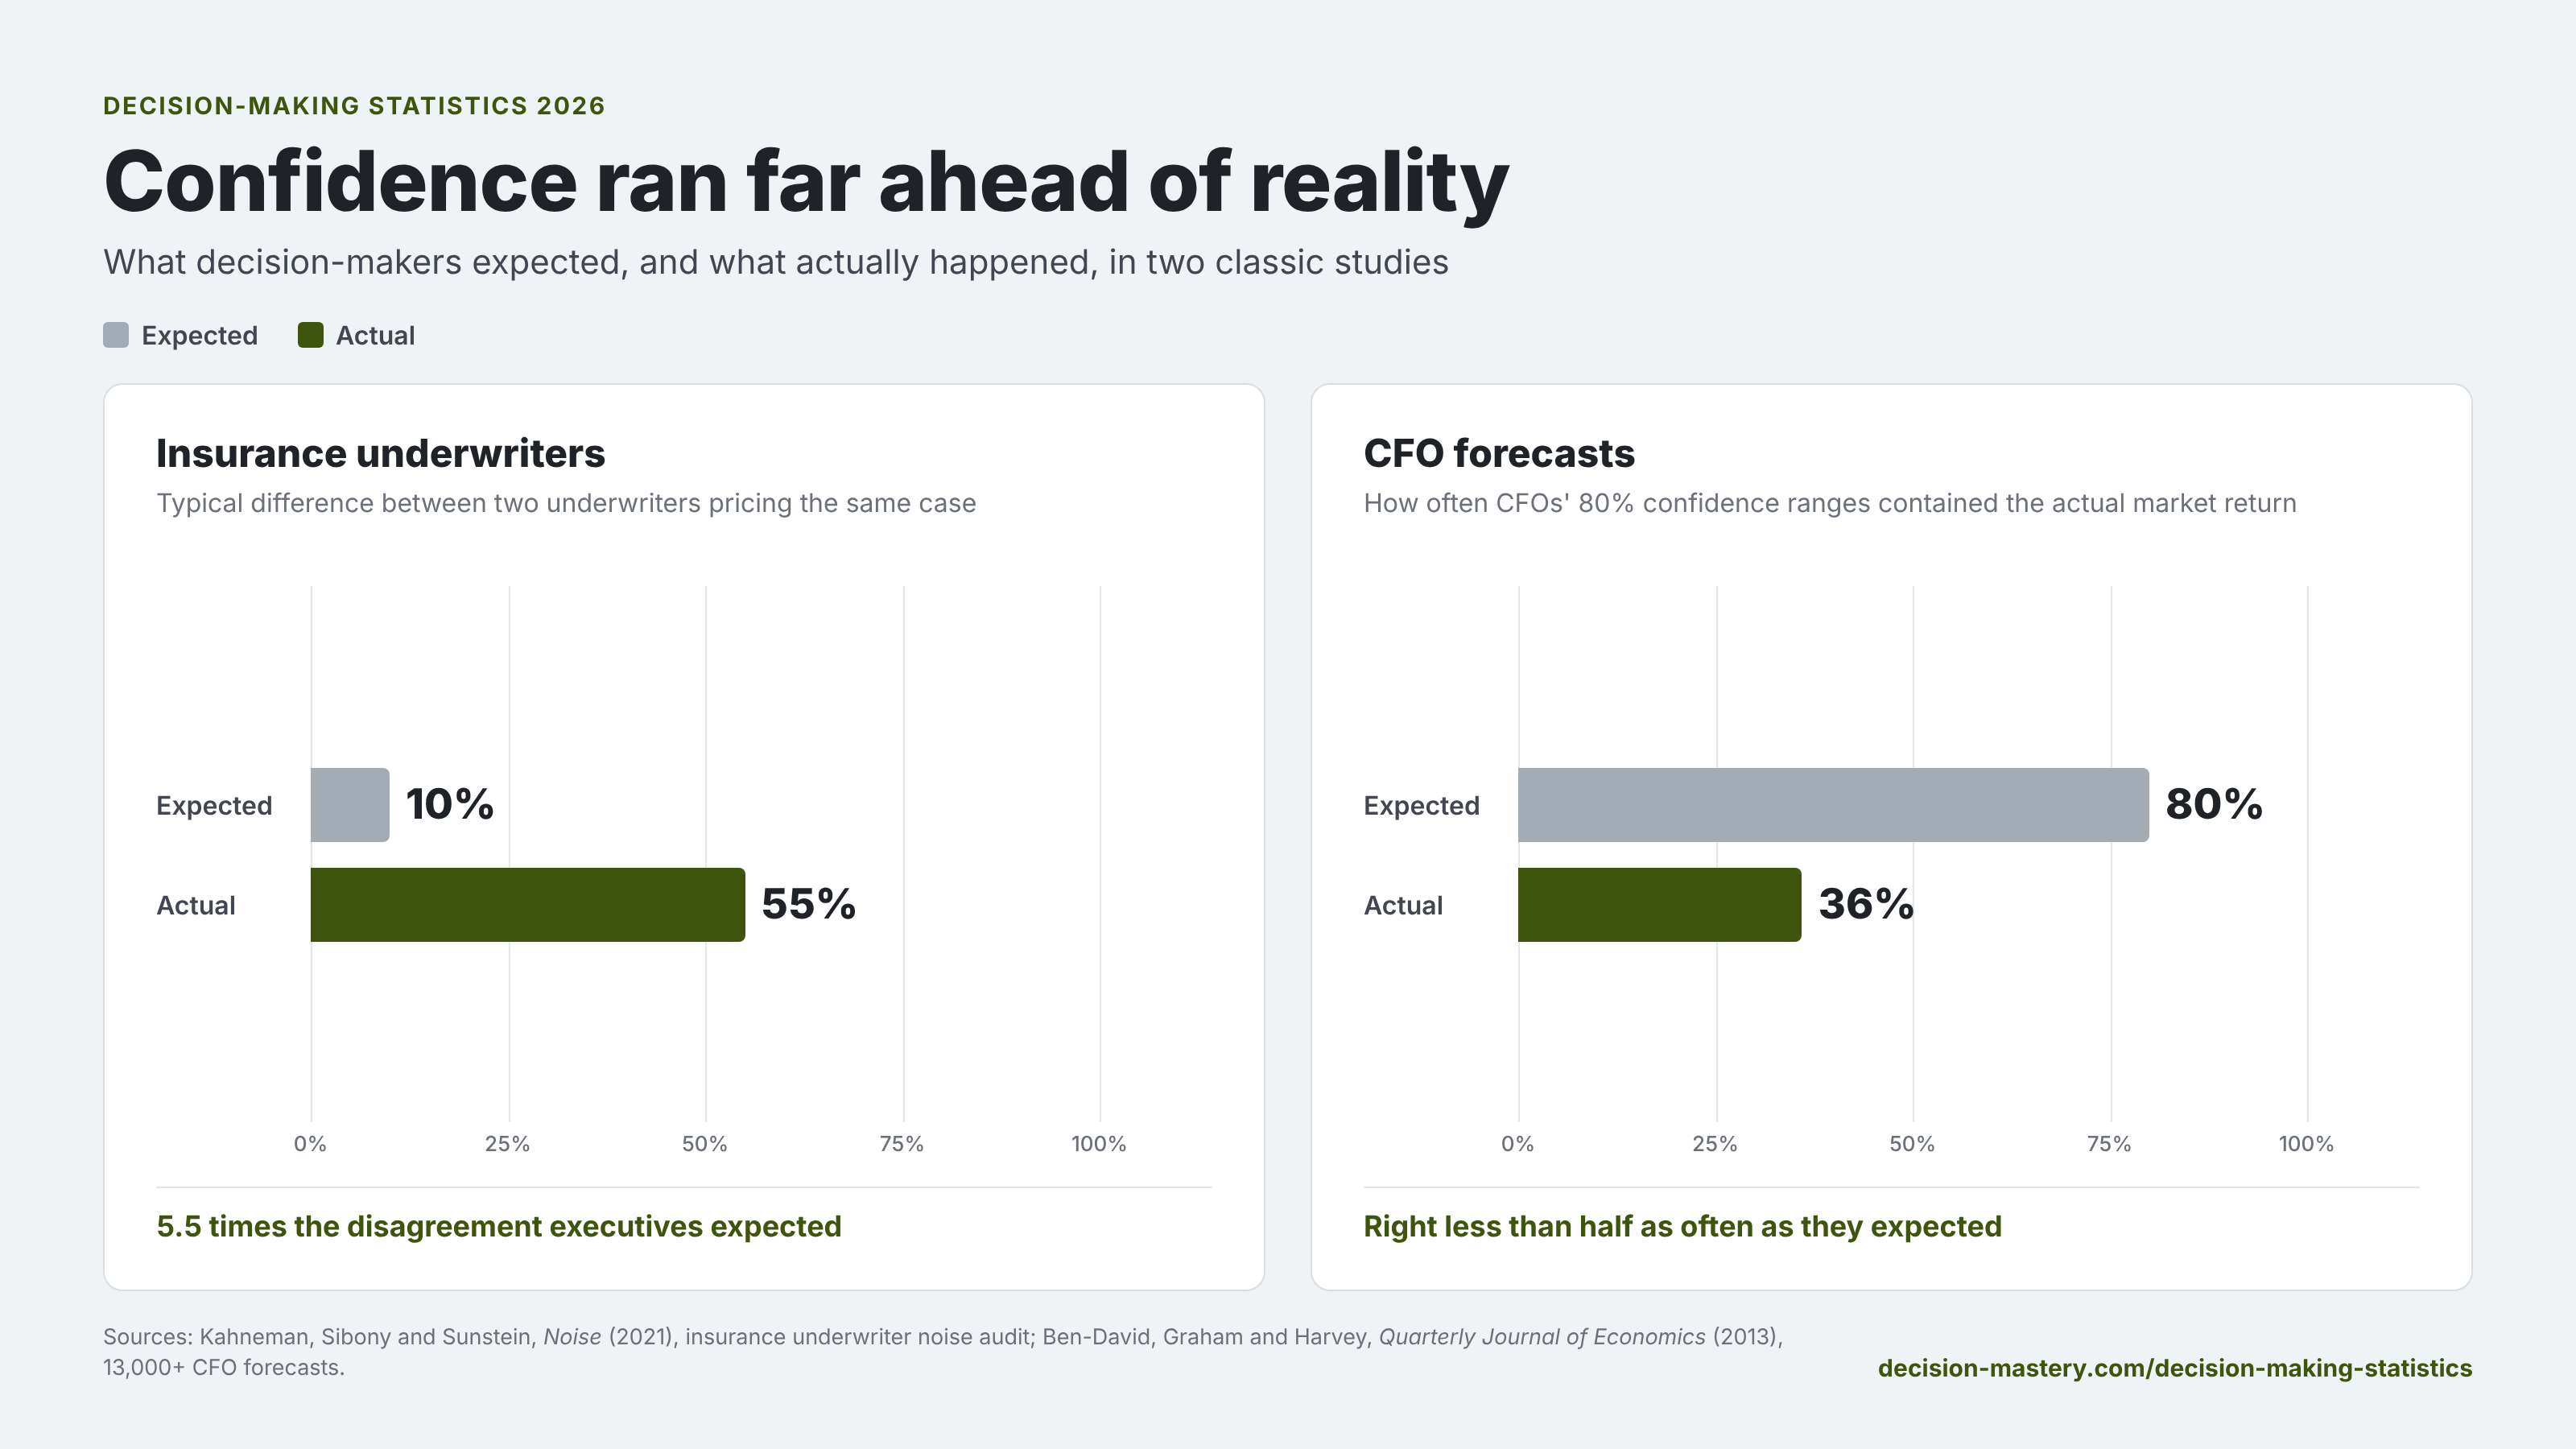
In both studies, people were far more confident than the results justified. Executives expected two underwriters' prices for the same case to differ by about 10%; the typical difference was 55%. CFOs' 80% confidence ranges caught the actual market return only 36% of the time.
Managers spend an average of 37% of their working time making decisions, according to a McKinsey survey of 1,228 executives. Most of them say the bulk of that time is wasted, and seniority makes only a small difference.
The survey was fielded in February 2018 among members of McKinsey's Online Executive Panel, a third of whom were C-level. These are self-reports, so they measure how executives experience decision making, which may differ from how it performs.
Related: Quick decision making: when speed is the right call
McKinsey estimates that ineffective decision making costs a typical Fortune 500 company more than 530,000 days of managers' time and about $250 million in wages a year. That figure is a modelled estimate, so it should be cited as one.
McKinsey calls the 530,000-day figure a thought experiment. It assumes 56,400 employees, 20% of them managers, 37% of their time on decisions and 58% of that time wasted, priced at the 2017 US median management salary.
The Bain figure is often repeated as a "95% correlation" between decision effectiveness and performance, including in some of Bain's own articles. The HBR article describes a 95% confidence level, which describes how certain the link is. It says nothing about how strong the link is.
Related: Why poor decision-making at work follows the same pattern
AI already makes a quarter of routine operational decisions, according to 2,000 CEOs surveyed by IBM in 2026, and they expect that share to reach 48% by 2030. At the same time, most employees who use AI at work rely on its output without checking it.
The IBM figures are CEOs' own estimates and expectations, and cover only decisions that can be written down as rules. They describe intent more than measured practice.
The Confluent survey shows how statistics drift. Press coverage reported that 62% of UK leaders use AI to make "the majority of their decisions", where Confluent's own page says only that 62% use AI to make decisions.
Related: Critical thinking: five questions to ask before deciding
Yes. In a study of 1,048 major business decisions, the quality of the decision process mattered six times more than the quality of the analysis behind it.
Lovallo and Sibony found almost no decisions made through a strong process that rested on very poor analysis. A good process tends to expose weak analysis, while strong analysis does little if the process never gives it a fair hearing.
The McKinsey speed finding is a correlation from self-reports. It suggests speed and quality can coexist, but it does not show that deciding faster improves quality.
Related: Why your decision-making process fails before anyone decides
Very. When chief financial officers gave ranges they were 80% sure would contain future stock market returns, the actual return landed inside them only 36% of the time.
The CFO study matters most for leaders because it measures senior executives making real forecasts, where the driver study used students. Tetlock's finding is often shortened to "experts are no better than a dart-throwing chimp", which overstates it.
Tetlock's better forecasters drew on many ideas and held their views loosely. Those committed to one big idea were the most confident and the least accurate.
Much less consistent than leaders assume. In a noise audit at one insurance company, the typical difference between two underwriters pricing the same case was 55%, more than five times the 10% their executives expected.
The authors call this unwanted variation noise, as distinct from bias. Bias pushes judgements in one direction, while noise scatters them, so two professionals looking at identical information reach different answers.
The audit covered one company, so the 55% figure describes that firm. The gap between what executives expected and what was found is the more transferable point.
Groups spend most of their discussion on what everyone already knows. Across 65 studies and 3,189 groups, teams whose members each held different pieces of the puzzle were about eight times less likely to find the right answer than teams given all the information.
Researchers call this the hidden profile problem, first described by Stasser and Titus in 1985. The best answer is hidden because no single member can see it, and the discussion keeps returning to common ground.
These are lab tasks with a correct answer, which real meetings rarely have. The pattern still applies whenever the person with the decisive fact is the one least likely to raise it.
Almost all of them do. Of more than 16,000 projects in Bent Flyvbjerg's database, 91.5% ran over budget, over schedule or both, and the worst overruns were far larger than the average suggests.
The IT figure shows what Nassim Taleb calls a fat tail. Most projects overrun by a moderate amount, but a minority fail by several times their budget, and those few dominate the total cost.
If you plan from the average overrun, you are planning for a project that the data says rarely exists. The useful question is how bad the bad cases get, and whether your project could be one of them.
The best-known bias studies hold up when you read them, but their figures are often quoted wrongly. The table gives each original result, so you can cite the study rather than a retelling of it.
Most of these studies used students and hypothetical choices, so they show that a bias exists more reliably than they show its size in a boardroom. The planning fallacy result matches what Flyvbjerg found in real projects: people's worst case is not bad enough.
Choice overload is the shakiest effect here. A later meta-analysis found that, averaged across studies, too many options does not reliably reduce choosing, so treat the jam study as one striking result rather than a rule.
People judge a decision by how it turned out, even when they believe they should not. In a 2023 replication of a classic 1988 study, participants rated an identical medical decision as better when the patient survived, including those who had said outcomes should not count.
Outcome bias is the reason a good decision with a bad result gets punished and a lucky one gets praised. Annie Duke calls the habit "resulting".
The sunk cost study is usually quoted without its ending. Paying more kept people coming for a few months, then the effect faded, which suggests the pull of past spending weakens with time.
The evidence is weaker than its popularity suggests. Ego depletion, the theory that willpower runs down with use, failed a 23-lab replication, and the best-known study of tired judges has a published rebuttal.
The parole study is still widely cited as proof of decision fatigue. The rebuttal argues that case order, which the original authors treated as random, can explain much of the pattern.
A later multi-site test of ego depletion, published in 2021, was inconclusive. Decision fatigue has not been ruled out. The evidence behind most claims about it is shaky.
Six widely shared decision-making statistics fail a source check: three have no traceable research behind them, and three are overstated, compromised or impossible to locate. Several appear on competing statistics pages, so check the origin before you cite them.
The 35,000 figure would mean roughly one decision every two seconds of waking life. Its persistence shows how a number spreads once enough credible-looking pages repeat it.
Most decision-making statistics found online cannot be checked. We audited the three highest-ranking decision-making statistics pages in October 2026: 233 of their 334 statistics (70%) name no source for the individual figure, and none links to the study it came from.
Two of the pages list dozens of source websites at the foot of the page without saying which figure came from which. The third names a journal and year for each statistic, and at least six of the ten citations we checked gave the wrong journal or the wrong year.
The same classic studies are misquoted most often. These are the versions you are likely to meet, and what the original research found.
A statistic that cannot be traced cannot be checked. Every figure on this page links to its source so you can verify it yourself.
Cite the original study for any figure you use, and link to this page as the place you found it checked. Each table names the study, the year and the sample, so you can cite both.
You are welcome to quote any figure, table or chart on this page, with a link back. The findings belong to the researchers and publishers named beside them.
Spotted an error or a better source? Tell us and we'll check it.
Next scheduled review: January 2027.
Studies get corrected, replicated and overturned. When a figure on this page changes, we email you what changed and what to cite instead. Nothing else.